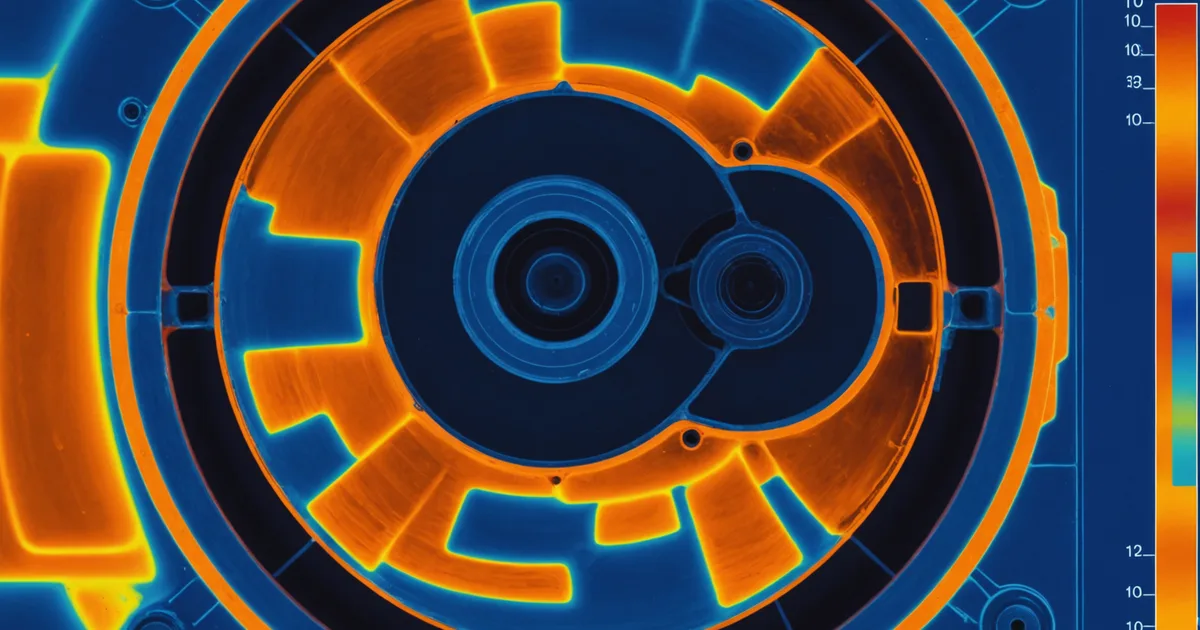
Temperature monitoring on rotating equipment tends to get treated as a coarse alarm tool. Set a high-temperature cutout at 80°C or 90°C on the bearing housing, wire it to a shutdown relay, done. As long as the bearing doesn't reach the setpoint, there's no problem. This approach misses most of what temperature data can actually tell you, and it misses it because the information is in the trend — the rate and pattern of temperature change — not in the absolute value.
Thermal drift, specifically, is the gradual upward movement in steady-state bearing operating temperature at consistent load and ambient conditions. A bearing that ran at 52°C for 18 months and now runs at 61°C under the same conditions is telling you something. The question is whether you're listening to that 9°C shift, and whether you know what different drift patterns are associated with different failure mechanisms.
Why Temperature Responds to Bearing Faults at All
Bearing heat generation has two primary sources: rolling element contact friction and oil churning losses. For a properly lubricated bearing at steady-state load, these are predictable from the bearing geometry, load, speed, and lubricant viscosity — ISO TR 13593 and bearing manufacturer thermal rating calculations give reasonable steady-state temperature predictions. Any deviation from that predicted steady-state baseline represents a change in the bearing's thermal behavior.
The fault mechanisms that alter bearing thermal behavior are well-established:
- Inadequate lubrication film: When the oil film between rolling elements and races thins — due to lubricant degradation, incorrect viscosity, starvation, or overheating reducing viscosity below the minimum required — the increase in metal-to-metal asperity contact increases friction and heat generation. Temperature rises before vibration changes, because the surface is experiencing increased friction-driven wear but hasn't yet developed macroscopic defects that would change the dynamic behavior.
- Over-lubrication: Excess grease in a rolling element bearing generates churning heat as the rolling elements continuously displace grease. This is a common cause of elevated bearing temperature following re-greasing intervals. The temperature signature: a sharp increase immediately after re-greasing, then gradual stabilization as excess grease is purged. If temperature doesn't return to baseline within 2–4 hours of normal operation post-greasing, the housing may be over-filled.
- Axial misalignment: Angular misalignment in a coupled drive increases the effective radial and axial load on the shaft bearings. Increased load generates increased heat, and the thermal signature often shows asymmetry between the DE and NDE bearings (or between the two bearings on a gearbox input shaft). The asymmetric pattern — one bearing running 5–8°C warmer than the other at symmetric positions — is a useful misalignment indicator that appears before vibration-based misalignment signatures are unambiguous.
- Rolling element or raceway defect: Once a spall or raceway defect is generating significant impact events at bearing defect frequencies, the additional energy dissipation at the defect site contributes to bearing temperature. This thermal response lags the vibration response — it's a Stage 2–3 indicator rather than Stage 0–1. But the rate of thermal increase as damage propagates can be a useful indicator of damage acceleration.
- Bearing preload or fit issues: Excessive interference fit on an inner ring, or loss of clearance due to thermal expansion in a housing that has reduced heat dissipation capability, results in increased bearing preload. Preloaded bearings run hotter. This shows up as a step change in operating temperature following maintenance (if the issue was introduced during bearing replacement) or as a gradual increase correlated with ambient temperature cycles in machinery without adequate thermal expansion accommodation.
The Drift Rate as the Primary Diagnostic Signal
Absolute temperature tells you whether you're hot or cold. Drift rate tells you whether you're getting worse. For most bearing thermal fault patterns, the drift rate is more diagnostic than the temperature level.
Consider two machines: Machine A runs at 75°C bearing housing temperature, has run at approximately this level for two years, and the temperature is stable. Machine B runs at 60°C, which is its established baseline, but has been trending upward at 0.8°C per week for the last six weeks. Machine B is the concerning one, despite running cooler in absolute terms. Machine A is operating in thermal steady-state, possibly at elevated load, but the thermal behavior is consistent. Machine B is experiencing a change in its thermal energy balance — something is changing.
Useful drift rate monitoring requires baseline establishment. For any given asset, you need at least 4–6 weeks of data at stable operating conditions to establish the normal operating temperature range and the normal short-term variability (accounting for ambient temperature changes, load cycles, etc.). Once you have that baseline, drift rate alarms become meaningful:
- A drift of >2°C/week over a 3-week sustained trend (after ruling out ambient temperature correlation) warrants investigation
- An absolute step increase of >5°C following a maintenance event (bearing replacement, re-lubrication) that persists for more than 4 hours warrants immediate review of the maintenance action
- A differential temperature increase of >5°C between DE and NDE bearings on a horizontal shaft, without a corresponding change in load, is an alignment indicator
These thresholds are starting points for most general rotating equipment — centrifugal pumps, industrial gearboxes, conveyor drives. High-speed equipment (turbines, high-speed compressors), equipment with inherently high operating temperatures, and equipment with high ambient temperature variability need plant-specific baseline establishment before these numbers apply.
Thermal Asymmetry Patterns and What They Mean
Some of the most diagnostic thermal signals come from comparing temperatures across multiple measurement points on the same machine rather than trending a single point. Thermal asymmetry — temperature differences between bearing positions that should be running at similar temperatures — is a strong indicator of specific fault types.
Gearbox Thermal Patterns
A properly operating parallel-shaft gearbox under steady-state load will show relatively uniform temperature distribution across its bearing housings at the same shaft stage. Significant asymmetry (>8°C between bearings on the same shaft) often indicates localized gear tooth contact loading — misalignment, worn gear teeth, incorrect gear mesh, or tooth profile damage. The hotter bearing is seeing higher load. The cause is often not in the bearing itself but in the gear mesh upstream of it.
A temperature increase localized specifically to the output stage bearings of a gearbox driving a high-inertia load (a compressor, a centrifugal pump with high specific speed) can indicate process-side overload — the machine is being driven harder than its thermal design point. Checking the temperature pattern against the load (motor current, torque) provides the context to distinguish bearing fault from process overload.
Centrifugal Pump Bearing Patterns
On a horizontal centrifugal pump, the thrust bearing (typically the NDE bearing on a back-pull-out pump, or the bearing adjacent to the impeller on an inline configuration) takes the hydraulic axial thrust load. As this bearing degrades — particularly if it's a paired angular contact bearing with incorrect preload — it will run hotter than the radial bearing. A significant NDE-to-DE temperature differential on a pump that has historically run symmetrically is worth investigating for thrust bearing condition before it develops into an axial failure that damages the shaft.
Cooling Tower Fan Bearings
Cooling tower fan bearings are an interesting case because the ambient temperature conditions are inherently variable (the fan is cooling water, so ambient temperature around the drive varies with weather and load). Thermal monitoring on these assets needs ambient compensation — normalizing the bearing temperature to a consistent ambient reference point. Without this normalization, a summer-to-winter temperature decrease in bearing housing temperature looks like an improvement, when it's actually just the ambient getting cooler. With ambient compensation, you can track the true thermal behavior independent of seasonal effects.
Temperature in a Multi-Sensor Context
The same point we made about oil particle counts and acoustic emission applies to temperature: it's most useful as part of a correlated picture, not in isolation. The thermal signal confirms and contextualizes what other signals are showing.
A bearing that shows acoustic emission increase, a rising oil particle count in the 6–14 µm range, and a 3°C/week thermal drift over six weeks is sending a consistent story across three independent detection methods. That correlation dramatically increases confidence in the fault diagnosis and in the urgency of the intervention — three independent sensors all pointing at the same conclusion is much stronger evidence than any one of them alone.
Conversely, a thermal increase without any change in vibration or oil particle counts often points not to bearing damage but to a lubrication or ambient condition issue — over-greasing, lubricant contamination, changed ventilation in the motor room, a blocked cooling fin. The thermal signal caught something real, but the diagnosis changes when you see that the other modalities are still at baseline.
This is precisely the scenario where sensor fusion earns its value — not by independently diagnosing each signal, but by using the combination of signals to distinguish fault hypotheses that would be indistinguishable from any single sensor alone. When we built Watsynq's multi-sensor fusion approach, the thermal correlation logic — specifically how drift rate on temperature integrates with AE and particle count trends — was one of the harder problems we worked through, because the thermal signal has the most sensitivity to non-bearing confounders and requires the most context to interpret correctly. Getting that context from correlated sensors is what makes the thermal trend actionable rather than just noisy.
Practical Deployment Considerations
For plants considering adding bearing temperature monitoring to their condition monitoring stack, a few practical notes:
Thermocouple vs. RTD: Type K thermocouples are the workhorse for bearing housing temperature monitoring up to 260°C — inexpensive, rugged, widely compatible with data acquisition systems. PT100 RTDs provide better accuracy at lower temperatures (relevant for precision monitoring in the 30–80°C range) and are preferred when you need ±0.5°C resolution for drift rate analysis. For general industrial bearings, Type K with a good installation is adequate.
Sensor placement: The bearing housing should be instrumented as close to the bearing OD as practical, on the load zone side (the side receiving the radial load). The axial position matters — placing the thermocouple in the center of the bearing width, not at the end cap, minimizes thermal gradient effects. Use thermal paste at the contact; an air gap of even 0.1mm introduces significant resistance at contact surfaces.
Sampling rate for drift detection: You do not need high-frequency temperature data for drift trending. A 5–15 minute average is appropriate for bearing thermal condition monitoring. Faster sampling introduces noise without adding information. The useful signal here is in trends over hours to weeks, not seconds.
Thermal monitoring is one of the least expensive condition monitoring modalities to add incrementally to an existing program. The hardware cost is modest, the data is easy to trend, and for several important failure mechanisms — lubrication breakdown, misalignment, over-lubrication, and early bearing preload issues — it provides detection capability that vibration analysis and oil particle counting don't deliver reliably at the same stage. Used as a corroborating signal alongside acoustic emission and particle counts, it completes a detection picture that covers the full timeline of rotating equipment bearing failure progression.